Snippets: Shortcuts to Custom Ninjery
Let’s talk about one of the reasons I like Binary Ninja’s API-first approach and how it makes it easy to manipulate, extend, and customize Binary Ninja as an analysis platform. In general, I think one of the best ways to increase understanding is to try to implement things yourself or extend existing tools. Binary Ninja makes this pretty straightforward, and I think writing and using snippets is the easiest way to build your own ninja powers and borrow the powers of other. I’m going to share the workflow for setting up your own snippet set as well as some of my favorite snippets.
Links: Jump to snippet explanations , or here if you just came for the snips.
Making Your Own Snipset
All users of Binary Ninja should be aware of the built-in Python console and how awesome it is to just be able to write a few lines and get the answer you want, but sometimes you need just a little more logic than fits in a few lines (and these days the console even resizes a bit instead of the old days when the console would only show one line at a time). Or maybe you want to reuse or share the code you’re writing. Snippets is the way to go for everything short of writing a plugin.
The workflow that I’d suggest is making your own set of snippets and syncing them to GitHub (or your own private git server if you prefer). This is the workflow that psifertex from Binary Ninja has set up as the example, and that’s what I’m doing here. It makes it easy to get your code if you ever find yourself needing to demo something to a friend or otherwise not on your machine.
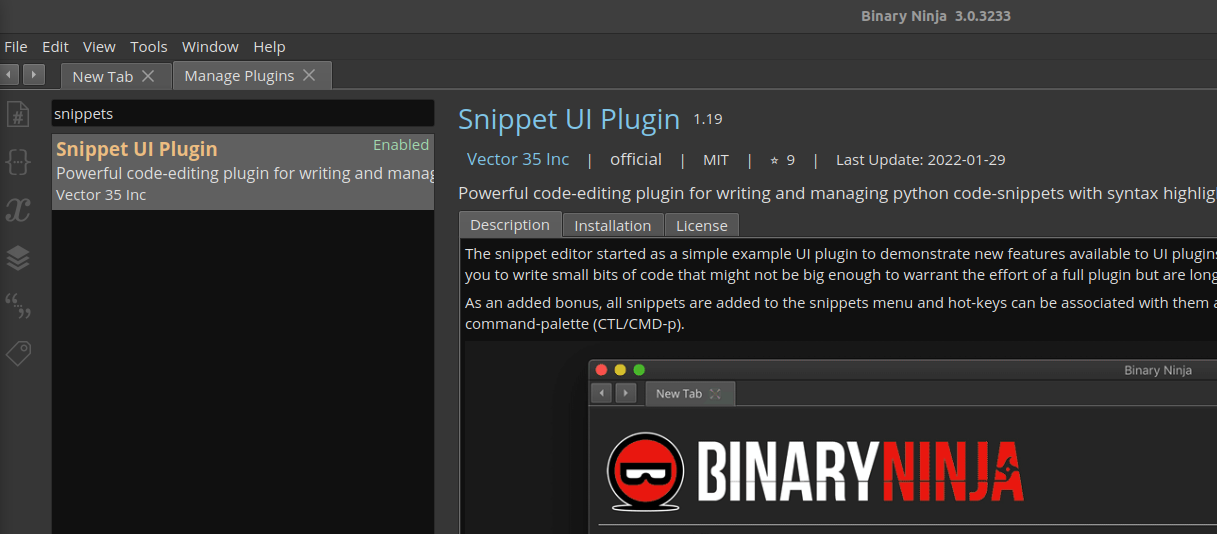
I started by popping into the plugin manager (CTRL+SHIFT+M) and making sure I
have the official Snippet UI Plugin with its golden name, and once it’s
installed/enabled we should see Snippets menu under Tools.
If you haven’t updated it in a while, it now comes with
an update_example_snippets.py that is also registered under the menu. Just run
this script and it pulls down snippets from a gist and into a folder.
Convenient, eh? This is the workflow I’m going to mirror.
First, start by forking
psifertex’s Snippet Collection
to get your own URL to point to, and then customize the contents. I opened up
update_example_snippets.py locally and fixed the path, folder, and
tab2space values to match my own, as shown below. I also changed the warning
message so I know it’s my snippets being updated and not the example ones.
path = b'mechanicalnull/b19c29ce38152b7304c2fad66168badd'
subfolder = 'mechanicalnull'
tab2space = True  # It's not worth arguing with strangers on the Internet
I then do Reload all snippets and run the update script. I see my custom
warning and my content (saved to the user folder, ~/.binaryninja/snippets),
and that means we’re off to the races!
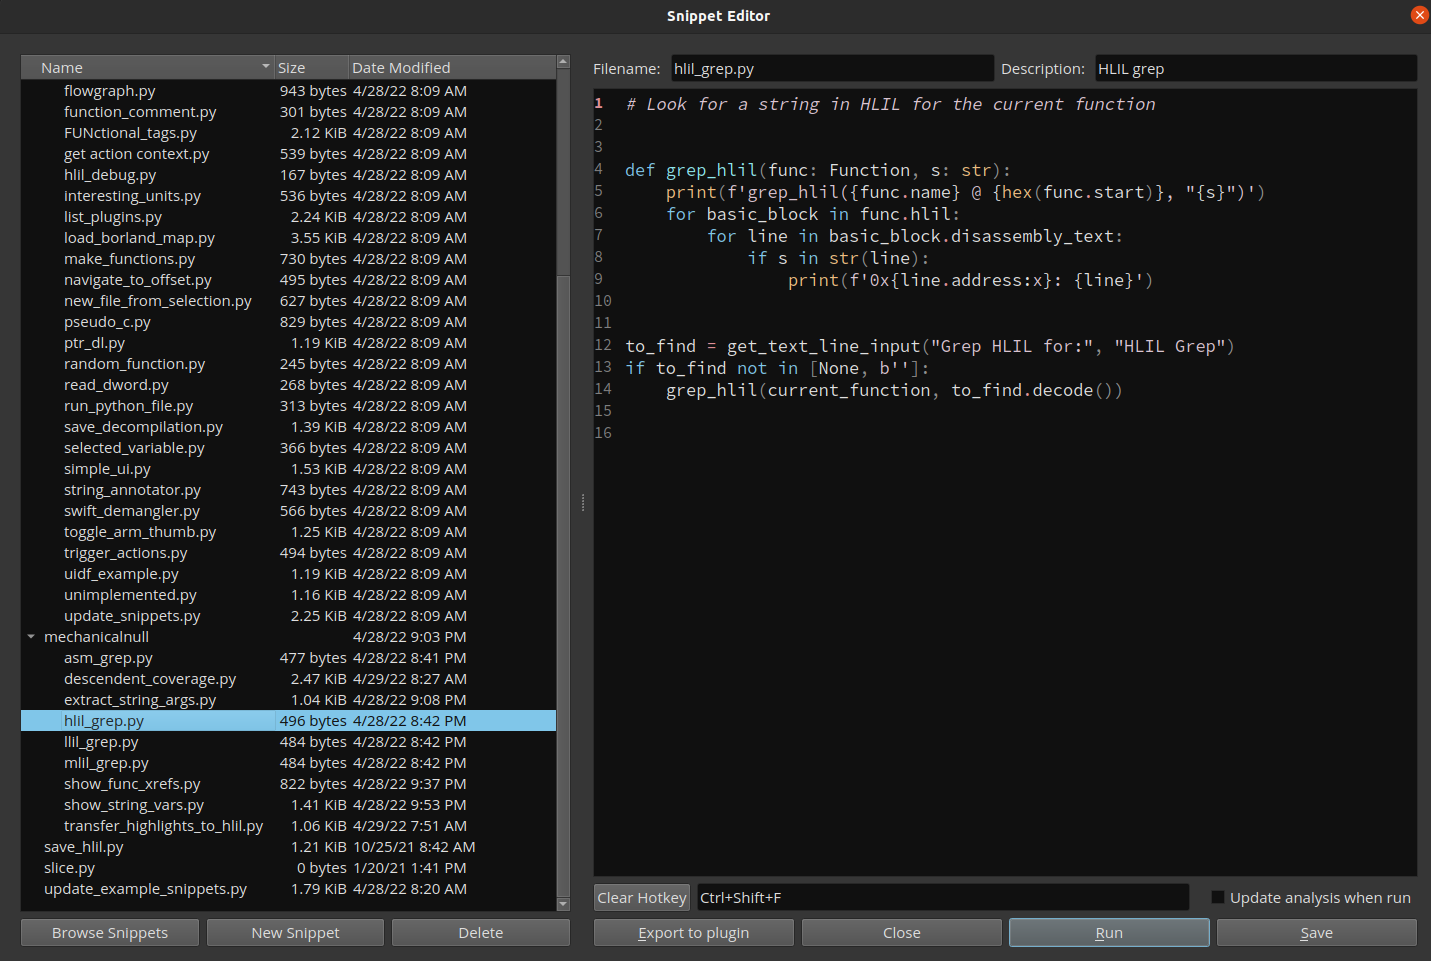
I like to code in a full IDE, so I don’t always use the snippet editor, but it does make the code/run/debug cycle very fast!
Snipping for Fun and Profit
I’m going to over the idea and show the primary functionality for each snippet, but if you want to grab them all, just check out the gist.
HLIL/MLIL/LLIL/assembly grep
This is as basic as it gets, but I find myself using this all the time. Handy for simple stuff like quickly tracking down the different locations a child function is called and with what args. I primarily use the HLIL grep, but the code is almost identical for each. Implementing a regex instead of simple string matching is an easy modification if you need that.
def grep_hlil(func: Function, s: str):
    print(f'grep_hlil({func.name} @ {hex(func.start)}, "{s}")')
    for basic_block in func.hlil:
        for line in basic_block.disassembly_text:
            if s in str(line):
                print(f'0x{line.address:x}: {line}')

to_find = get_text_line_input("Grep HLIL for:", "HLIL Grep")
if to_find not in [None, b'']:
    grep_hlil(current_function, to_find.decode())
Show Everywhere This Function is Called
This isn’t that different than grepping, but it pivots off cross-references to avoid looking at every function and every basic block. Useful for similar reasons as grep, and sometimes this is what you want instead of the normal xref window because this allows you to see the HLIL call or do any other programmatic functionality you want on an xref…
def find_func_xrefs(bv: BinaryView, func_name: str):
    try:
        func_to_find = next(f for f in bv.functions if func_name in f.name)
    except StopIteration:
        print(f'"{func_name}" not matched in function names')
        return

    xrefs = {
        xref.address: xref.function
        for xref in bv.get_code_refs(func_to_find.start)
    }

    if len(xrefs) == 0:
        print('No xrefs to "{func_name}" found!')
        return
    else:
        for addr, func in sorted(xrefs.items()):
            hlil = func.get_llil_at(addr).hlil
            print(f'{hex(hlil.address)}: {hlil}')
Extract String Arguments
This is a variation of one I shared in my crackaddr rematch post, and it can come in handy if you want to extract string arguments from particular functions, either for forming a dictionary or for just for RE purposes. This also allows you to specify or filter out functions if you are only interested in certain functions.
string_args = set()
filter_out = ['printf']  # Names of functions to skip
keep_only = []           # Match only these function names

for mf in bv.mlil_functions():
    for ml_inst in mf.instructions:
        if ml_inst.operation == MediumLevelILOperation.MLIL_CALL:
            # filter on function names
            called_function = bv.get_function_at(ml_inst.operands[1].value)
            if not called_function:
                continue
            if filter_out and called_function.name in filter_out:
                continue
            if keep_only and called_function.name not in keep_only:
                continue
            # CALL args are third in "operands"
            for arg in ml_inst.operands[2]:
                if isinstance(arg, MediumLevelILConstPtr):
                    maybe_string = bv.get_string_at(arg.value)
                    if maybe_string:
                        string_args.add(maybe_string.value)

for s in sorted(string_args):
    print(repr(s))
Show Me Current Function Strings!
Just another string helper, but this one uses LLIL to try to get strings and is helpful when you’re looking at understanding a function or pivoting on string xrefs.
def get_pointers(bv: BinaryView, llil_inst: LowLevelILInstruction):
    for i, operand in enumerate(llil_inst.operands):
        if not hasattr(operand, 'operation'):
            continue
        if operand.operation == LowLevelILOperation.LLIL_CONST_PTR:
            address = operand.value.value
            var = bv.get_data_var_at(address)
            if var:
                yield var
        else:
            get_pointers(bv, operand)

def show_string_vars(bv: BinaryView, func: Function):
    string_refs = {}
    for llil_inst in func.llil_instructions:
        for var in get_pointers(bv, llil_inst):
            var_sym =  bv.get_symbol_at(var.address)
            if var_sym:
                var_name = var_sym.name
            else:
                var_name = f'data_{var.address:x}'
            if re.search(r'char.*[\[0-9a-fx]\]', str(var.type)):
                str_pointed_at = bv.get_ascii_string_at(var.address, min_length=1)
                if str_pointed_at is not None:
                    real_str = f'"{str_pointed_at.value}"'
                else:
                    real_str = '<Failed to get string>'
                string_refs[var.address] = f'{var_name}: {real_str}'
bncov Translate Block Highlight to Instructions (Enable HLIL Highlight)
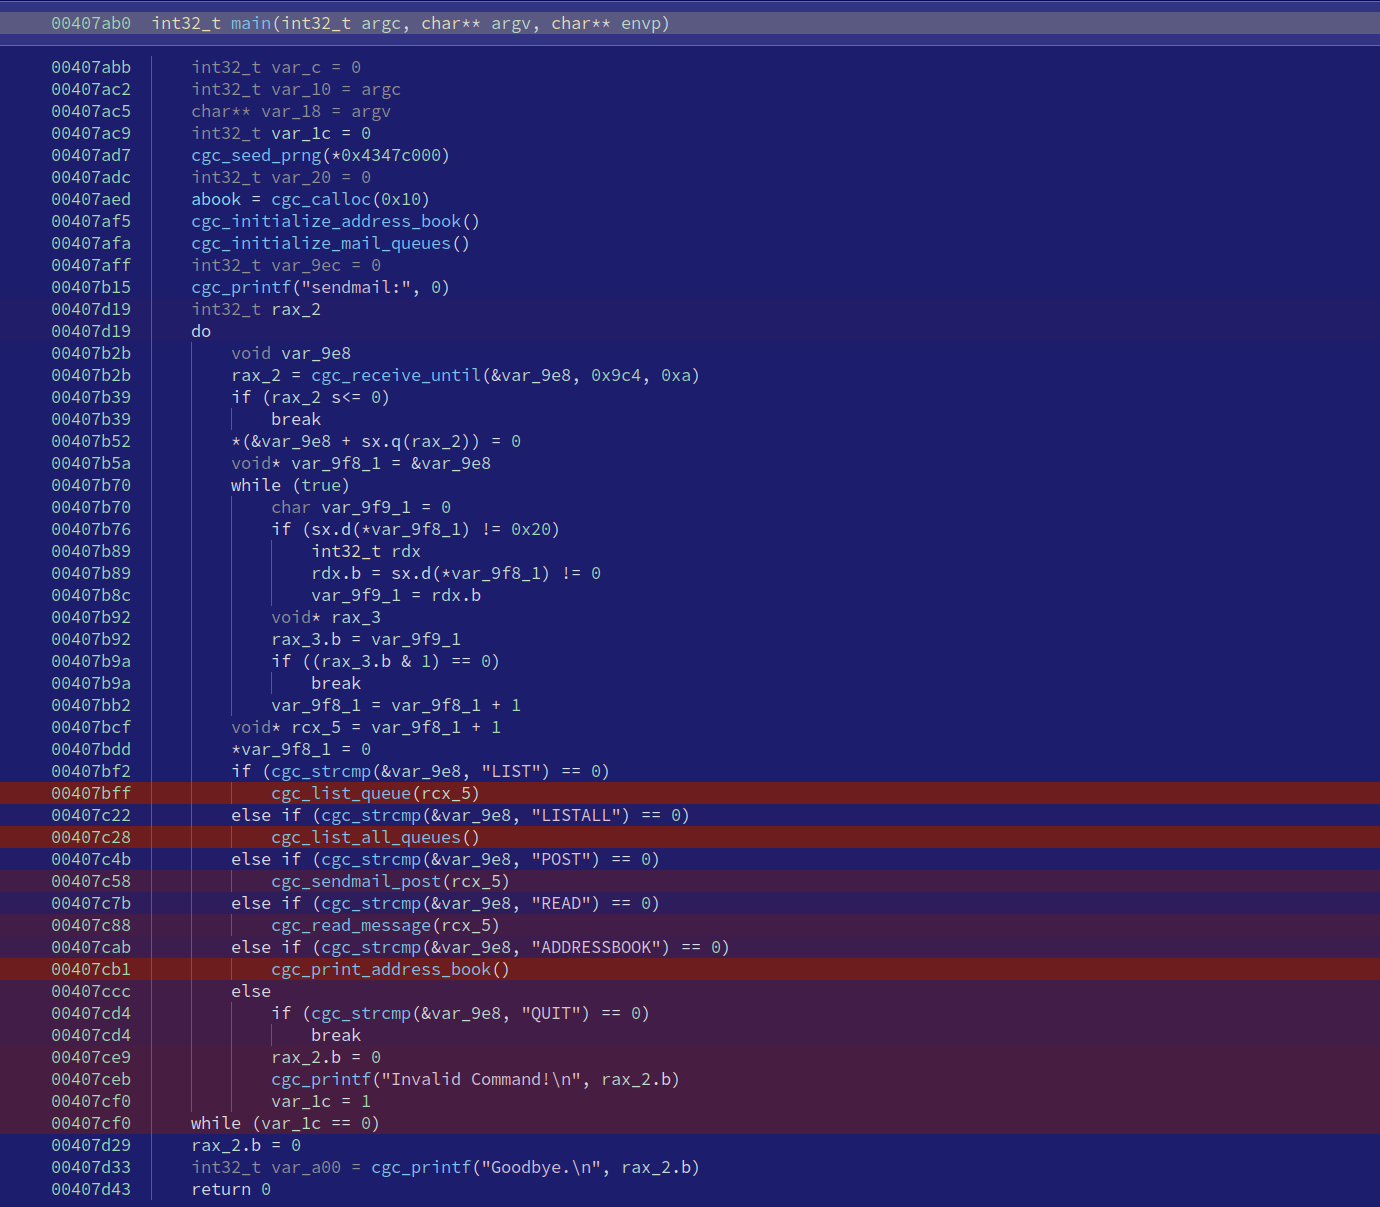
This is probably the most slick snippet in terms of visual appeal, something that I tried out on a whim and it worked. Having block highlighting not show up on HLIL is one of those things most people (including myself) expected to come for free, but no, not yet anyway. This translates block highlights to instruction highlights, which looks a little off in graph view, but it makes HLIL highlighting work.
I’ve considered upstreaming this into bncov, but I’m just conservative with things
like these where there’s potential for confusion between assembly basic blocks
and HLIL instructions when it comes to coloring, because I like my tools to
always show ground truth and warn when they introduce uncertainty. If you try
this out on the example data provided with bncov
(bncov/tutorial/example/fuzztest) you’ll see how a number of blocks with
different colors get collapsed into one long HLIL statement.
def transfer_highlights_to_instructions(covdb: bncov.CoverageDB):
    bv = covdb.bv
    for block_address in covdb.total_coverage:
        for block in bv.get_basic_blocks_starting_at(block_address):
            cur_highlight = block.highlight
            block.set_user_highlight(HighlightStandardColor.NoHighlightColor)
            cur_function = block.function
            cur_addr = block.start
            for cur_token, cur_inst_size in block:
                cur_function.set_user_instr_highlight(cur_addr, cur_highlight)
                cur_addr += cur_inst_size
Show Child Function Coverage
Another bncov helper, this one helps with the common pattern of quickly determining how much coverage there is below the current function.
def recursive_print_node(
    cur_func: Function,
    function_coverage: dict,
    level: int,
    seen: Set[Function]
) -> Set[Function]:

    indent = '    '
    coverage_string = get_coverage_string(cur_func, function_coverage)

    if cur_func in seen:
        return seen

    print(f'{indent * level}{coverage_string}')
    seen.add(cur_func)

    children = set(cur_func.callees)
    sorted_children = sorted(
        children,
        key=lambda f: function_coverage[f.start].coverage_percent,
        reverse=True
    )
    for next_func in sorted_children:
        child_saw = recursive_print_node(next_func, function_coverage, level + 1, seen)
        seen.update(child_saw)

    return seen


def print_child_coverage(covdb: bncov.CoverageDB, func: Function):
    if not covdb.function_stats:
        print('Collecting function coverage statistics (one-time)...')
        function_coverage = covdb.collect_function_coverage()
    else:
        function_coverage = covdb.function_stats

    recursive_print_node(func, function_coverage, 0, set())
Show Functions With Most Unique Paths
This approximates “unique paths” with bncov since block coverage doesn’t actually have full path information. It does give an idea of how many different ways through a function have been exercised. Just an idea I’ve been toying with regarding complexity and how much has been exercised.
def count_block_sets(covdb: bncov.CoverageDB, blocks: List[int]) -> int:
    trace_coverage = {}
    for cur_block in blocks:
        for trace in covdb.block_dict[cur_block]:
            trace_coverage.setdefault(trace, []).append(cur_block)
    coverage_sets = set([str(sorted(v)) for v in trace_coverage.values()])
    return len(coverage_sets)


def count_function_paths(covdb):
    bv = covdb.bv
    function_dict = covdb.get_functions_from_blocks(covdb.total_coverage)
    function_counts = {}
    for function_start, block_starts in function_dict.items():
        func = bv.get_function_at(function_start)
        unique_block_sets = count_block_sets(covdb, block_starts)
        function_counts[func] = unique_block_sets

    for func, num_sets in sorted(
        function_counts.items(),
        key=lambda kv: kv[1],
        reverse=True
    ):
        print(f'{func.name} @ {hex(func.start)}: {num_sets}')
EOS (End of Snips)
That wraps the snippets I wanted to share, give them a try and drop me a DM on Twitter if you find anything wrong or know a better way of doing one of these.
Now it’s time for you to take up the Snippet Challenge and write an awesome snippet and share it, maybe on the Binary Ninja Slack or Twitter!