Seeing How the FUZZausage is Made with Fuzzwatch
One of the things I’m most curious about when I’m using tools is how they’re actually working under the hood. I think this desire to understand what’s going on and how things works internally is a big reason why I do what I do. Since I have this quirk and (I assume other people do too), I like sharing how things work, and one of my favorite ways to do that is with visualizations.
Down the Rabbit Hole
Well-known fuzzers do a lot of really smart things internally, so naturally they have a decent amount of code and complexity going on, but fuzzing itself is actually very simple and I feel like the idea can be understood by anybody. Despite this, I couldn’t find a simple thing I could point at and convincingly tell someone “that’s fuzzing happening, right there.”
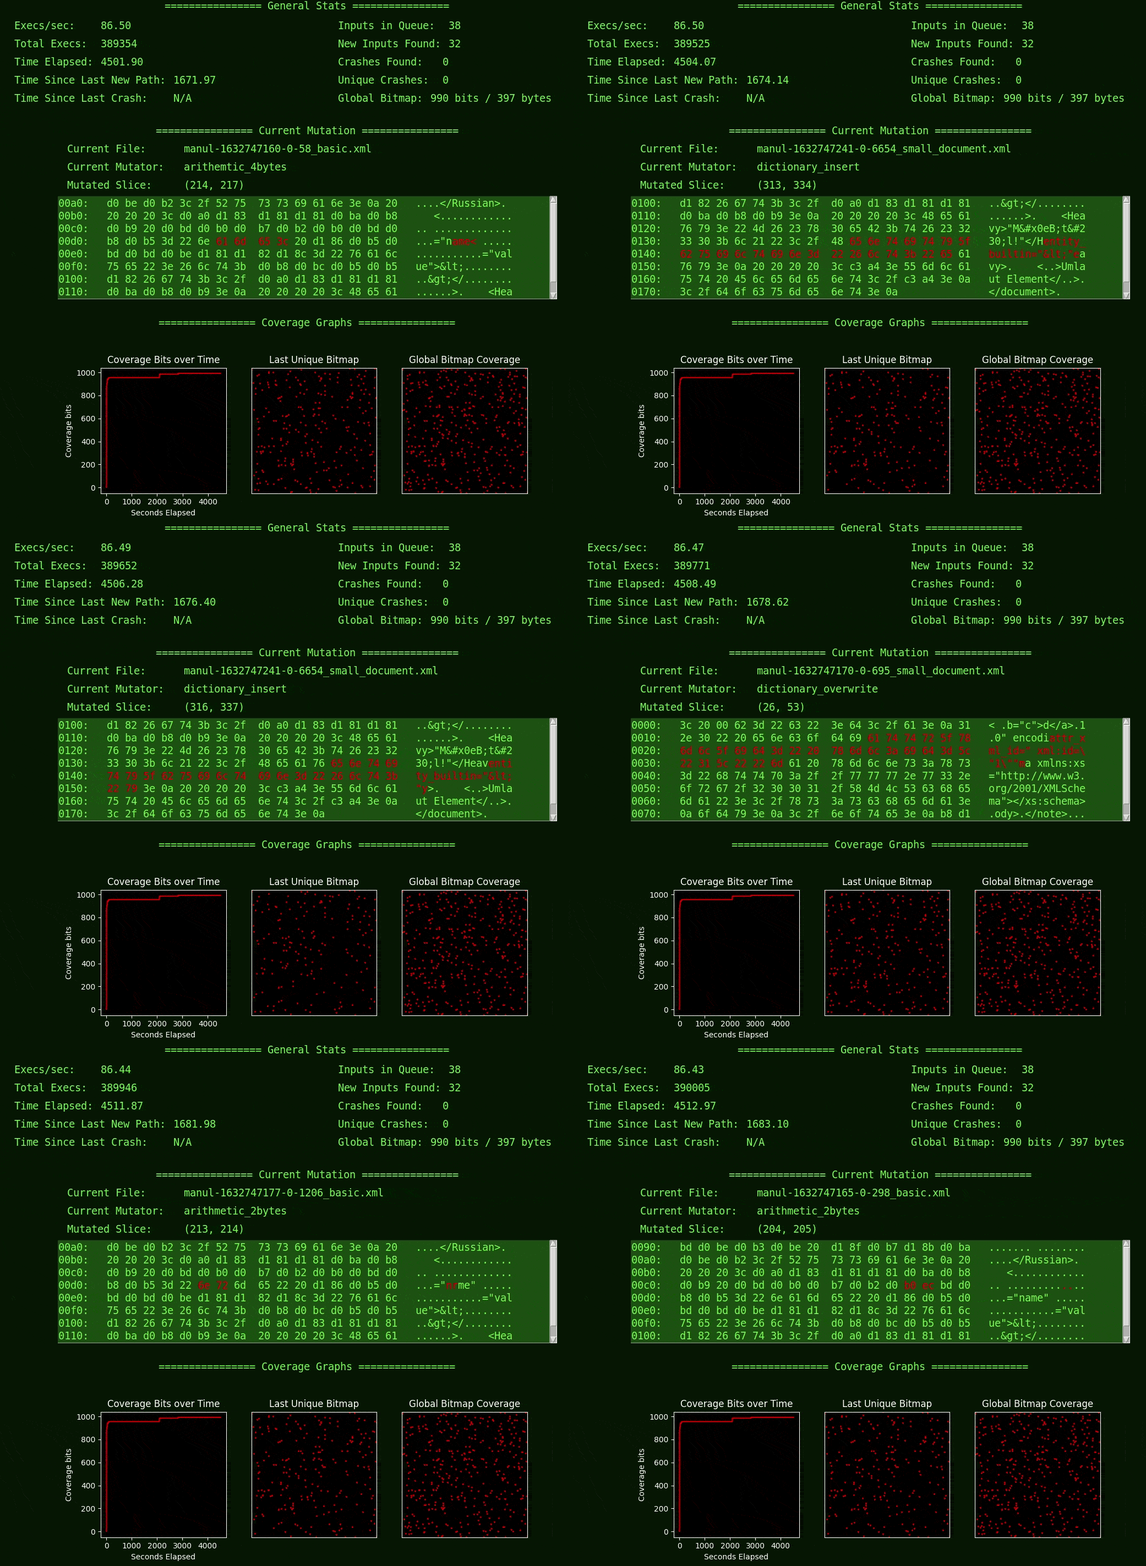
The closest I had seen was a few people who posted GIFs of input mutations, and so I thought I’d just start writing something and seeing where it went. In addition to building something to show fuzzing, I also wanted to play with a particular Python GUI package and figured this was a good opportunity to do so. The end result is a little GUI I released recently on GitHub, called Fuzzwatch.
Through the Looking Glass

I started with the fuzzer Manul because I was curious how it differed from AFL (which Manul is based on) and also because it is written in Python and therefore easier to for me to integrate with PySimpleGUI. I did the bare minimum to get the current-mutation display done, and when I finished adding the bit that shows the name of the current file, I learned something. I learned something about Manul in moments of watching this simple UI that I didn’t know after hours of reading and writing code (it was about power schedules, for the curious).
I thought that was pretty neat, so that’s when I decided I wanted to share Fuzzwatch.
In addition to basic statistics, Fuzzwatch shows mutation-based coverage-guided fuzzing by displaying both the current mutated input and the coverage bitmap output, which is how the fuzzer models the target and its behaviors (an approach that originated from AFL and is shared by many other “grey-box” fuzzers). If you haven’t thought about this or don’t understand how that works, it might be interesting to give this baby a spin, or perhaps you’d prefer to read up on some fuzzer docs instead.
There’s more things Fuzzwatch could show or do, but I’m also working on being better about not being such a perfectionist, so I thought it’d be better to release it than to spend more time on something that may not matter. Certainly more work to be done in the future, either by myself or bold and intrepid community members…
What is it but a dream?
Honestly, Fuzzwatch isn’t an advance in fuzzing research and it doesn’t make fuzzing better. What it does do is show something that normally would be hidden, buried in the guts of the fuzzer because it takes (unnecessary) effort to constantly ferry data out of the core of the fuzzer and display it. It also doesn’t try to show anything about what’s going on in the target during fuzzing, but stay tuned if you’re curious about that!
So yes, it’s more of a teaching tool, but I hope it makes people curious to ask questions about how fuzzers work. Because I think if we can ask good questions, we can make better tools. Plus I like making visualizations. So now I can point to something and say: “this is fuzzing, right here”, and maybe it can do that for you too.
